The data center is becoming the power plant of the AI economy.
It is now the most capital-intensive, power-constrained and publicly scrutinized building in technology. It still runs on tools designed for a world where power was easy and AI was not in the control room. Aidni is building the operating layer for what comes next.
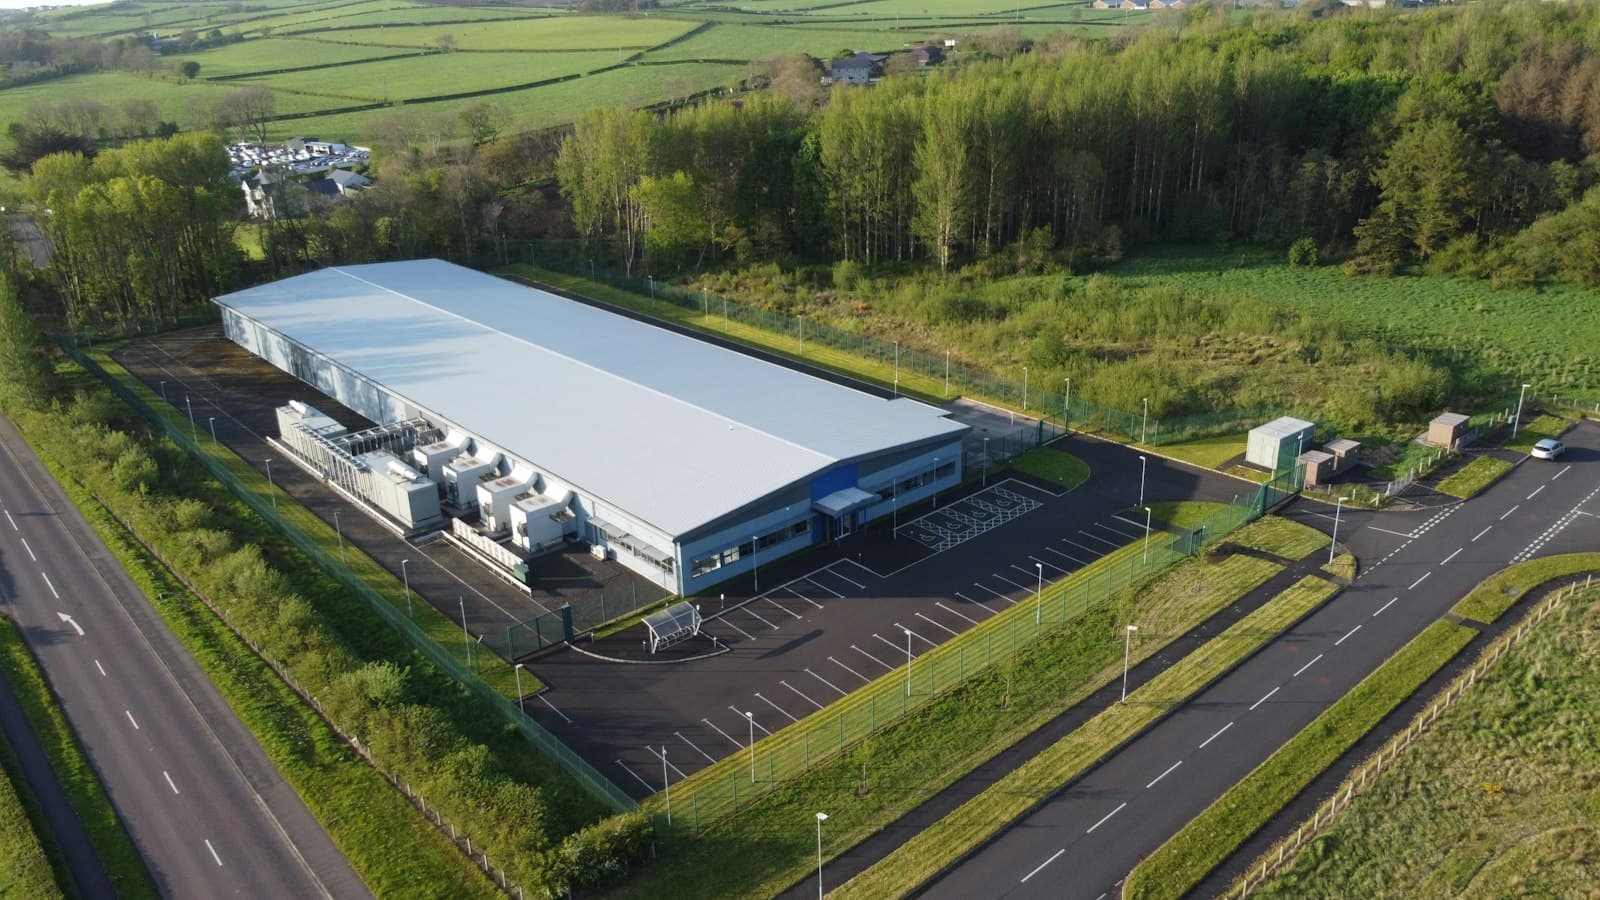
Four shifts are rewriting how data centers are built and run.
Demand more than doubles
Global data-center electricity use is projected to grow from about 415 TWh in 2024 to about 945 TWh by 2030, with AI the main driver.
Source: IEA, Energy and AI (2025)The grid becomes the gate
US data centers used 4.4% of national electricity in 2023 and could use 6.7–12% by 2028. Getting power to the site is now what decides when compute comes online.
Source: LBNL (2024)Flexibility becomes capacity
The US grid could absorb 76–126 GW of new load if those loads can flex for 0.25–1% of the year. Data centers that can prove and deliver flexibility connect sooner.
Source: Duke Nicholas Institute (2025)Autonomy arrives, with guardrails
AI controlling live cooling systems inside safety constraints has delivered around 30% average energy savings at Google and a 6.6% PUE gain at a 2 MW AI-ready site.
Source: See case studiesWhat Aidni does that the field does not do today.
| Contribution | How it is done today | What Aidni introduces |
|---|---|---|
| The Facility Graph | Power, cooling, space and workloads live in separate systems (EPMS, BMS, DCIM, schedulers) that do not share a model. | One typed model of every power, thermal and compute asset and how they connect, so any question about the site has one answer. |
| Power-first compute planning | Interconnection, rack layout and GPU procurement are planned by different teams, in different tools, on different timelines. | Compute is planned directly against delivered megawatts, phase by phase, and every month of delay is priced in lost accelerator life. |
| A governed agent interface for critical infrastructure | AI is either kept out of operations entirely, or given broad tool access that no operator can safely audit. | Two verbs, Observe and Propose, scoped by policy and approved by people, executing only through controls the operator already owns. |
| Disclosure as a by-product of operations | Energy and water figures are assembled by hand each quarter from systems that disagree. | Reports are generated from the operating model itself, with formula and meter lineage behind every number. |
Better operations are the fastest new capacity.
New substations and transmission lines take years. Using the power a site already has, and proving it can flex when the grid needs it, can happen this year.
For operators
Compute costs more than the building and ages out in a few years. Every megawatt planned well and every month of delay avoided is capital returned.
For the grid
A site that can see and govern its own load can offer flexibility to its utility, which is how new capacity connects faster without new peak demand.
For communities
Energy and water performance that anyone can recompute replaces debate about anecdotes with debate about numbers.
For the AI build-out
Faster, safer energization of AI capacity is a competitive question for the United States. The bottleneck is operational as much as it is physical.
Building toward a data center that can describe, plan and explain itself.
- 2026 · now
Found
Company formed, platform architecture defined, technology partnership in autonomous cooling, design-partner recruiting.
- 2027
Validate and launch
Facility Graph and Conduit Observe live with design partners; Propose with human approval; Ledger v1.
- 2028
Grid-interactive operations
Conduit proposes load flexibility to utilities from live headroom; multi-site Portfolio; air-gapped deployment.
- 2029+
An open standard
Publish the Facility Graph schema and agent interface so any operator, vendor or utility can build on one model of the data center.
Roadmap dates are targets.
Bounded AI already works in real facilities.
A partner deployment in Tennessee, Google's hyperscale results and a shipped enterprise agent interface show each part of the approach working in production.
Bring us one site. We will show you its real capacity.
A six-week Site Assessment maps the power envelope, the cooling design and the compute plan for one facility, delivered by the engineers who build the platform.