Water use is a design choice. Make it with the numbers.
Thermal compares cooling architectures — air, rear-door, direct-to-chip liquid, closed-loop or evaporative — on capacity, energy and water before the mechanical design is locked.
| Stage | 02 · Build |
|---|---|
| Reads | Facility Graph |
| Upstream | Aidni Grid |
| Hands off to | Aidni Conduit |
| Primary output | Cooling architecture comparison |
Why this system exists
- 01
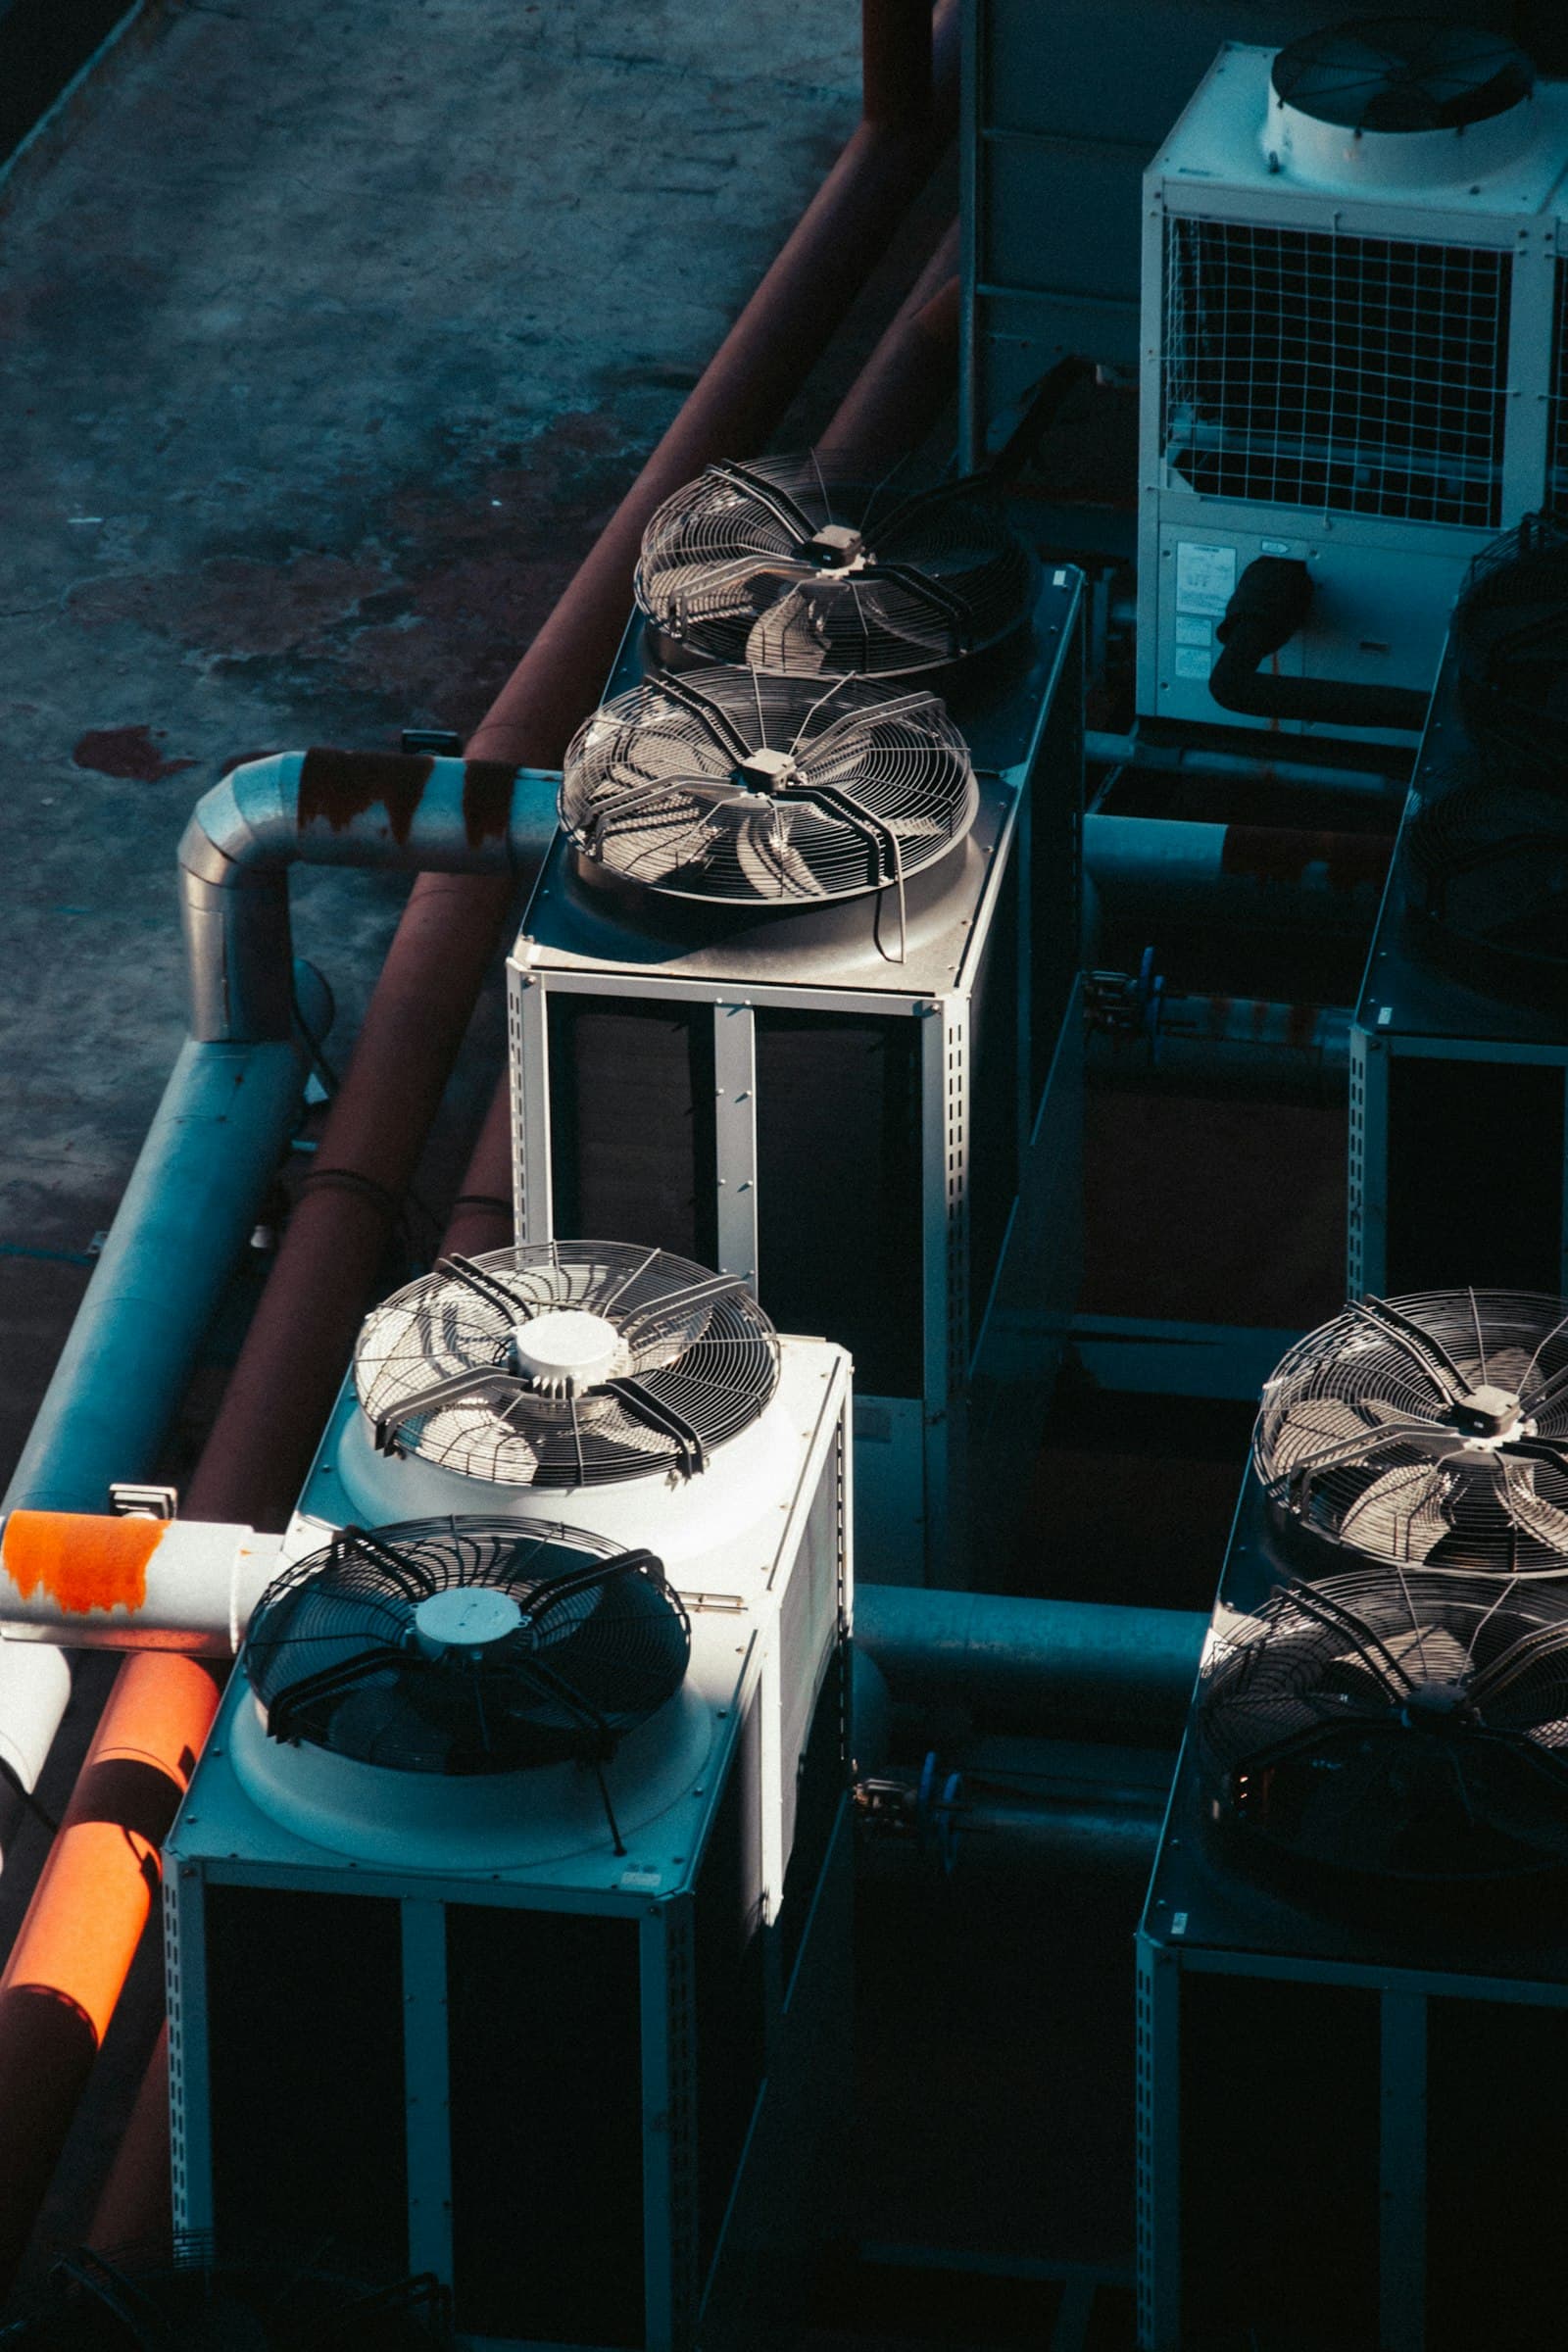
A data center's water footprint is dictated by its cooling design. Closed-loop systems recirculate water in a sealed circuit and consume almost none; evaporative systems consume water continuously.
- 02
Rack densities above 100 kW move heat rejection from the room to the chip. Decisions about CDUs, facility water temperature and heat rejection now set the ceiling on compute.
- 03
Permitting bodies and communities ask hard questions about water. Operators who cannot show the math lose time, or lose the site.
The mechanism, step by step.
Model the thermal chain
Chillers, dry coolers, pumps, CDUs, cold plates and rooms are linked to the racks they serve, with capacity and redundancy at every hop.
Compare architectures
Each candidate design is scored on supportable kW per rack, annual energy, peak and annual water consumption, and failure tolerance.
Check liquid readiness
Thermal tests whether a hall can take direct-to-chip racks: facility water capacity, CDU sizing, floor loading and redundancy.
Hand off to Ledger
The chosen design's water and energy model becomes the baseline Ledger reports against once the site is live.
Same compute, different water.
Compare annual on-site water consumption for an evaporative and a closed-loop design at the same IT load.
WUE values are editable assumptions; enter your design's figures. Water consumption = IT energy × WUE. Burger equivalent uses ~460 gallons per quarter-pound beef patty (Mekonnen & Hoekstra, Ecosystems, 2012). Not an engineering design.
- Cooling architecture comparison
- Annual water and energy model
- Liquid-cooling readiness review
- Design basis for permitting
- BMS trend data
- Mechanical schedules
- Weather and climate data
- OEM cooling specifications
Water and energy decided together, then carried forward. Cooling studies are usually one-off consultant reports that disappear after design. Thermal scores architectures on capacity, energy and water in one model, and the chosen design becomes the live baseline the site is measured against.
Why this matters for the field →Bring us one site. We will show you its real capacity.
A six-week Site Assessment maps the power envelope, the cooling design and the compute plan for one facility, delivered by the engineers who build the platform.